Fellow RJMetrician Austin Lopez and I competed in a data visualization contest/hackathon called VizWars at WHYY last night. It was hosted by Acumen Analytics and Tableau.
The goal was to come up with the best visualization from either NCAA Basketball tournament statistics or Earthquake data they provided. This is what we came up with.
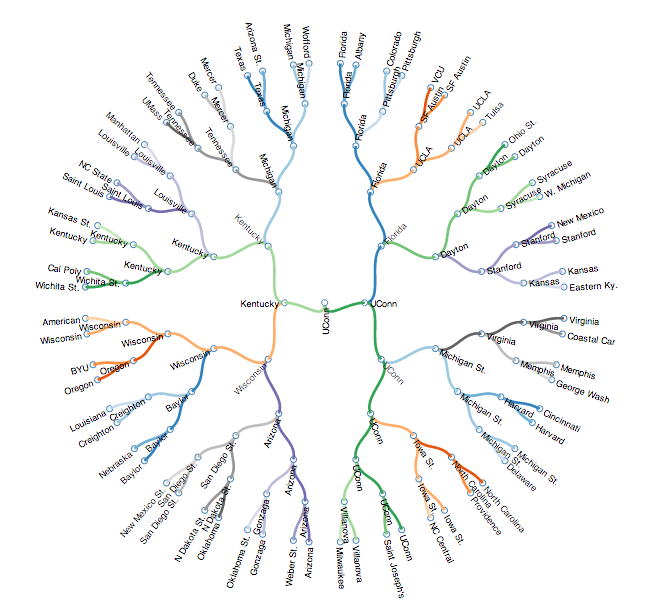
The D3 animation shows the progression of each round in a clustered dendrogram. Each team is colored to make it easier to follow their path through the tournament. We won Best Pro Team, although we would have loved another 20 minutes to get more things working. Our goal was to set the line thickness to various game metrics like point differential, # of fouls, turnovers, etc.
Out of 5 teams, we took the title of Best Pro Team (of which I think there were only two).
Leave a Reply